
Extreme events and climate change

Consider the Paris Agreement where countries around the world have agreed to reduce greenhouse gas emissions with the goal of limiting global warming to well below 2°C, preferably to 1.5°C, compared to pre-industrial levels. Some people think “Who cares? It was 2°C warmer today than it was yesterday. 2°C is peanuts!”. Or consider sea-level rise. That could be around 3mm/year along the coast of Otago. That’s 3cm in a decade. Again peanuts, right? A wave could be 5 metres high so why are we worried about a 3cm rise over a decade?
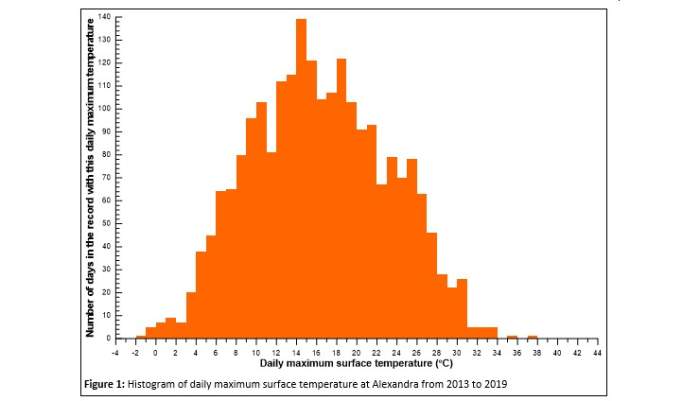
In this piece I want to talk a little about why these apparently small numbers matter. Let’s start with temperature and consider the daily maximum temperature we experience each day in Alexandra, i.e., the highest temperature recorded throughout the day. There may be a few days where the daily maximum temperature hardly gets above 1 or 2°C (those nasty overcast days in winter) and then also a few days in each year when the hottest it gets during the day could be more than 30°C (those baking hot summer days when you just have to take the dogs to the lake). But it’s more likely that the most common daily maximum temperature is somewhere in the middle, i.e., around 15°C.
Let’s go and take a look at the data. In Figure 1 (below) I have taken hourly temperature data for Alexandra and calculated the daily maximum temperature for all days with 24 hours of data to arrive at 2,224 values. I have then counted the number of values in each 1°C bin (a histogram). You can see that the most typical daily maximum temperature value is somewhere around 14 or 15°C. On 44 days in that historical record the daily maximum surface temperature exceeded 30°C.
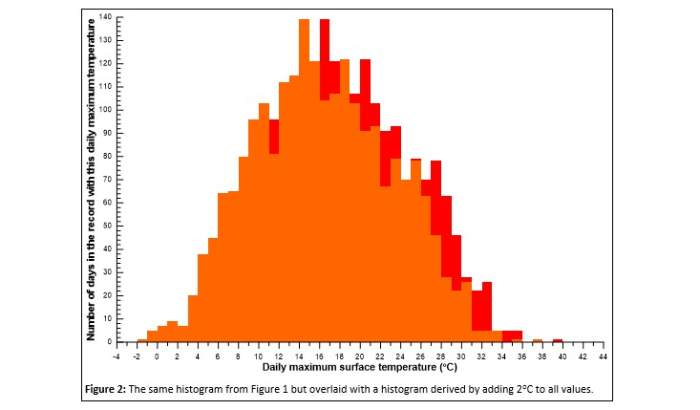
Now what happens if I go and add 2°C to every data point (simulating the threshold for the Paris Agreement). I have done that and plotted the new histogram (in red) behind the old histogram (in orange) in Figure 2 (below). Now when I go and count the number of days when the daily maximum temperature is above 30°C I find that there are 95 days! That 2°C of warming caused a 216% increase in the number of days where the daily maximum temperature exceeds 30°C. And it’s these hotter than 30°C days that have the greatest impact in terms of affecting crops, drying out the soil, causing heat stress to farm animals, etc. We’re not concerned about the days where the maximum temperature is 15°C and that goes to 17°C under global warming. It is these really hot days whose frequency can more than double that’s the problem.
And this is true for most climate variables. It is the changes in the extremes that really cause the damage, not the changes in the average. An apparently small increase in sea level can cause the number of times a protective seawall is breached to double. A 1°C warming of the atmosphere can cause a 7% increase in the capacity of the atmosphere to hold water, but the number of times severe rainfall exceeds some threshold to double. This is why we are seeing 1-in-100-year events becoming 1-in-50-year events; that’s what doubling the frequency of extreme weather events does.
When you see these apparently small changes in various climate variables, don’t confuse these with the much higher day-to-day variability that we see. Unlike day-to-day variability, these climate induced changes lift the entire data record, causing thresholds to be breached far more frequently. Beware the extremes, the jaws that bite the claws that catch.
Related Stories
-

Batteries and storing energy
“Nothing is more dangerous than an idea when it’s the only one we have” as Émile-Auguste Chartier once said. This quote springs to mind when I think of the Lake Onslow scheme. For those who may not know about the Lake Onslow scheme, the idea is to convert Lake Onslow, which sits in a shallow depression in the hills between Roxburgh and Middlemarch, into a giant battery. Importantly, Lake Onslow is around 685m above sea level while the Clutha River downstream from Roxburgh is at around 94m above sea level. That’s a 591m difference (see, those three years of maths at university are paying off).
Read more about Batteries and storing energy -
The Central Otago Destination Management Plan and Climate Change
CODC recently released its Destination Management Plan (DMP). I have read it and I think it’s excellent – and painful. Why painful? Because change is painful and this DMP highlights many changes to the way we do things that will be required. In this piece, I am going to share my thoughts on those aspects of the required changes articulated in the DMP that relate to climate change and are directly relevant to tourism services providers. Climate change poses an existential threat to some of the values that underpin the DMP, in particular Mauri - pressures imposed by land and water use are already being exacerbated by climate change and will be more so in the future.
Read more about The Central Otago Destination Management Plan and Climate Change -
Wood-burners and climate change
I often get asked about whether using wood-burners for interior heating contributes to climate change. For the purposes of this article, let’s set aside the effects that the use of wood-burners have on out-door air quality. Smoke from using wood-burners contributes to poor air quality; you only need to walk around Alexandra on a cold winter’s night with a strong inversion layer to notice that. But that’s mostly a different issue to climate change – I say ‘mostly’ because the aerosols (smoke) from wood-burners, if anything, make a small contribution to cooling the climate by reflecting solar radiation back to space before it reaches the ground.
Read more about Wood-burners and climate change


